
Why Solar Energy is the Future of Global Power Systems?
- The Solar Revolution: A Decade of Explosive Growth
- The Economics: The Cheapest Energy Source in History
- The Global Energy Mix is Fundamentally Shifting
- Climate Imperative: The Carbon Equation
- Jobs, Investment, and Economic Opportunity
- Solar Resource Potential: A Global Perspective
- Challenges and the Path to Solutions
- The Road Ahead: Solar Scenarios to 2050
- Bangladesh and the RENRLab Connection
- Conclusion
- References
The Solar Revolution: A Decade of Explosive Growth
In 2010, the world had roughly 40 gigawatts (GW) of installed solar PV capacity — barely enough to power a medium-sized nation for a single day. By 2026, that figure has surpassed 1,900 GW, representing a nearly 50-fold increase in just 16 years. No energy technology in human history has ever scaled this rapidly.
The growth is not merely impressive — it is accelerating. The International Energy Agency (IEA) recorded more solar capacity additions in 2023 alone than the entire global solar fleet contained just eight years prior. Nations from Germany and China to India and Chile are racing to install solar panels on rooftops, in deserts, above irrigation canals, and on reservoir surfaces — a growing practice called floatovoltaics.
The drivers are not ideological. They are economic, strategic, and increasingly existential. As fossil fuel price volatility exposed the vulnerability of import-dependent nations, solar’s domestic, inexhaustible nature became a strategic asset alongside its falling cost curve. At RENRLab, our work on hybrid renewable energy systems (HRES) — including grid-connected solar farms paired with EV charging infrastructure — reflects and contributes to this global momentum.
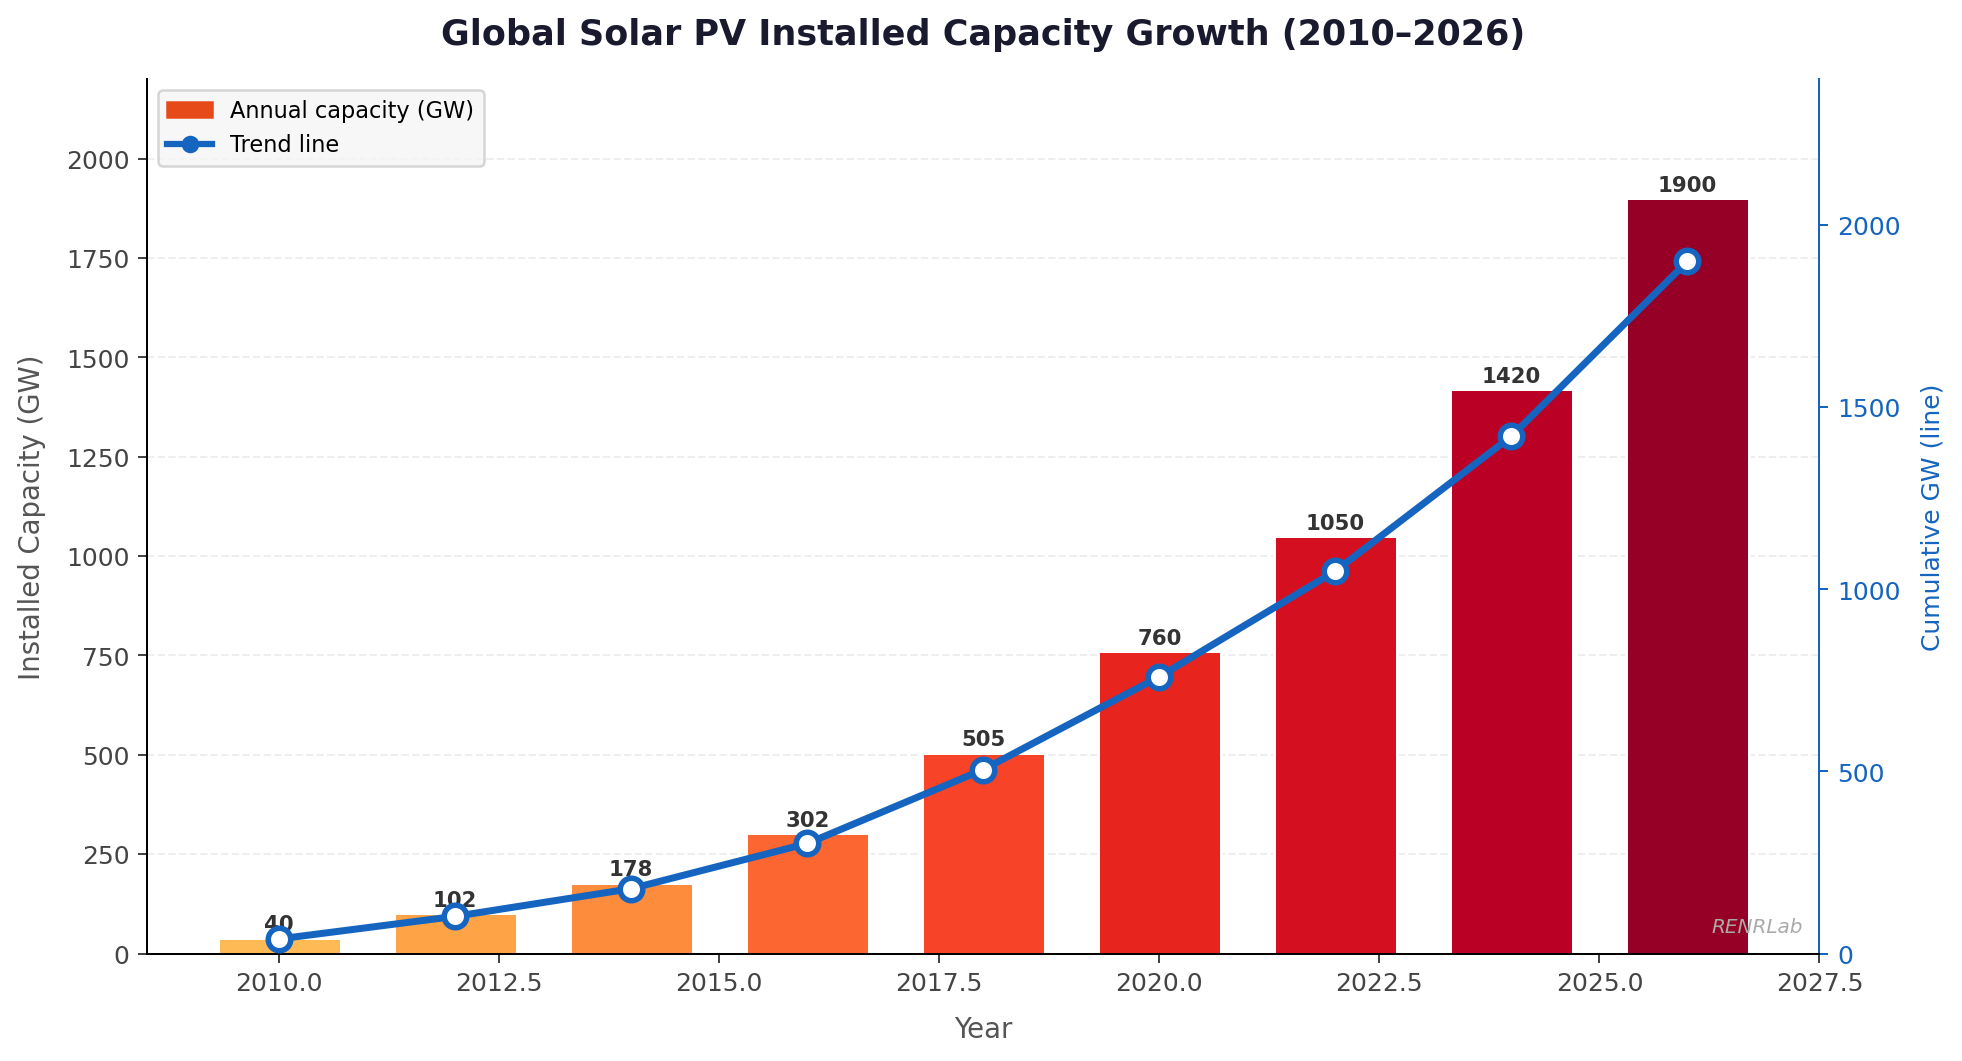
As Figure 1 clearly shows, the trajectory is not linear — it is exponential. Each year, more capacity was added than the cumulative total just a decade earlier. This compounding effect means that the next ten years of solar expansion will dwarf all prior growth combined, and infrastructure planners, policymakers, and energy researchers must plan accordingly.
The Economics: The Cheapest Energy Source in History
Perhaps the most consequential development in modern energy economics is the breathtaking collapse in the cost of solar electricity. In 2010, the Levelized Cost of Energy (LCOE) for utility-scale solar PV was approximately $350–400 per MWh — far more expensive than coal or natural gas. By 2024, solar auction prices in sun-rich regions had reached a record low of $12–29 per MWh.
The IEA declared utility-scale solar PV “the cheapest source of electricity in history” in 2020, and the trend has continued to deepen. This dramatic price reduction is governed by what engineers call the Swanson Effect — a learning curve analogous to Moore’s Law in semiconductors — whereby every doubling of cumulative solar capacity reduces the cost by approximately 20%. Since 2010, solar manufacturing has doubled roughly 12 times over, explaining the extraordinary cost decline.
Key Drivers of Cost Reduction
- Massive investment in manufacturing at scale, particularly in China, which now produces over 80% of the world’s solar panels — driving module prices from $4/Watt in 2008 to under $0.20/Watt in 2024.
- Improvements in photovoltaic cell efficiency — from ~15% for early commercial panels to 23–26% for modern high-efficiency PERC and TOPCon modules.
- Reduction in balance-of-system costs: racking, inverters, wiring, and installation have all seen 60–80% cost reductions since 2010.
- Competitive global auction markets that drove power purchase agreement (PPA) prices to historic lows across dozens of countries.
- Institutional investor confidence in solar as a predictable, long-term asset class, enabling low-cost project financing.
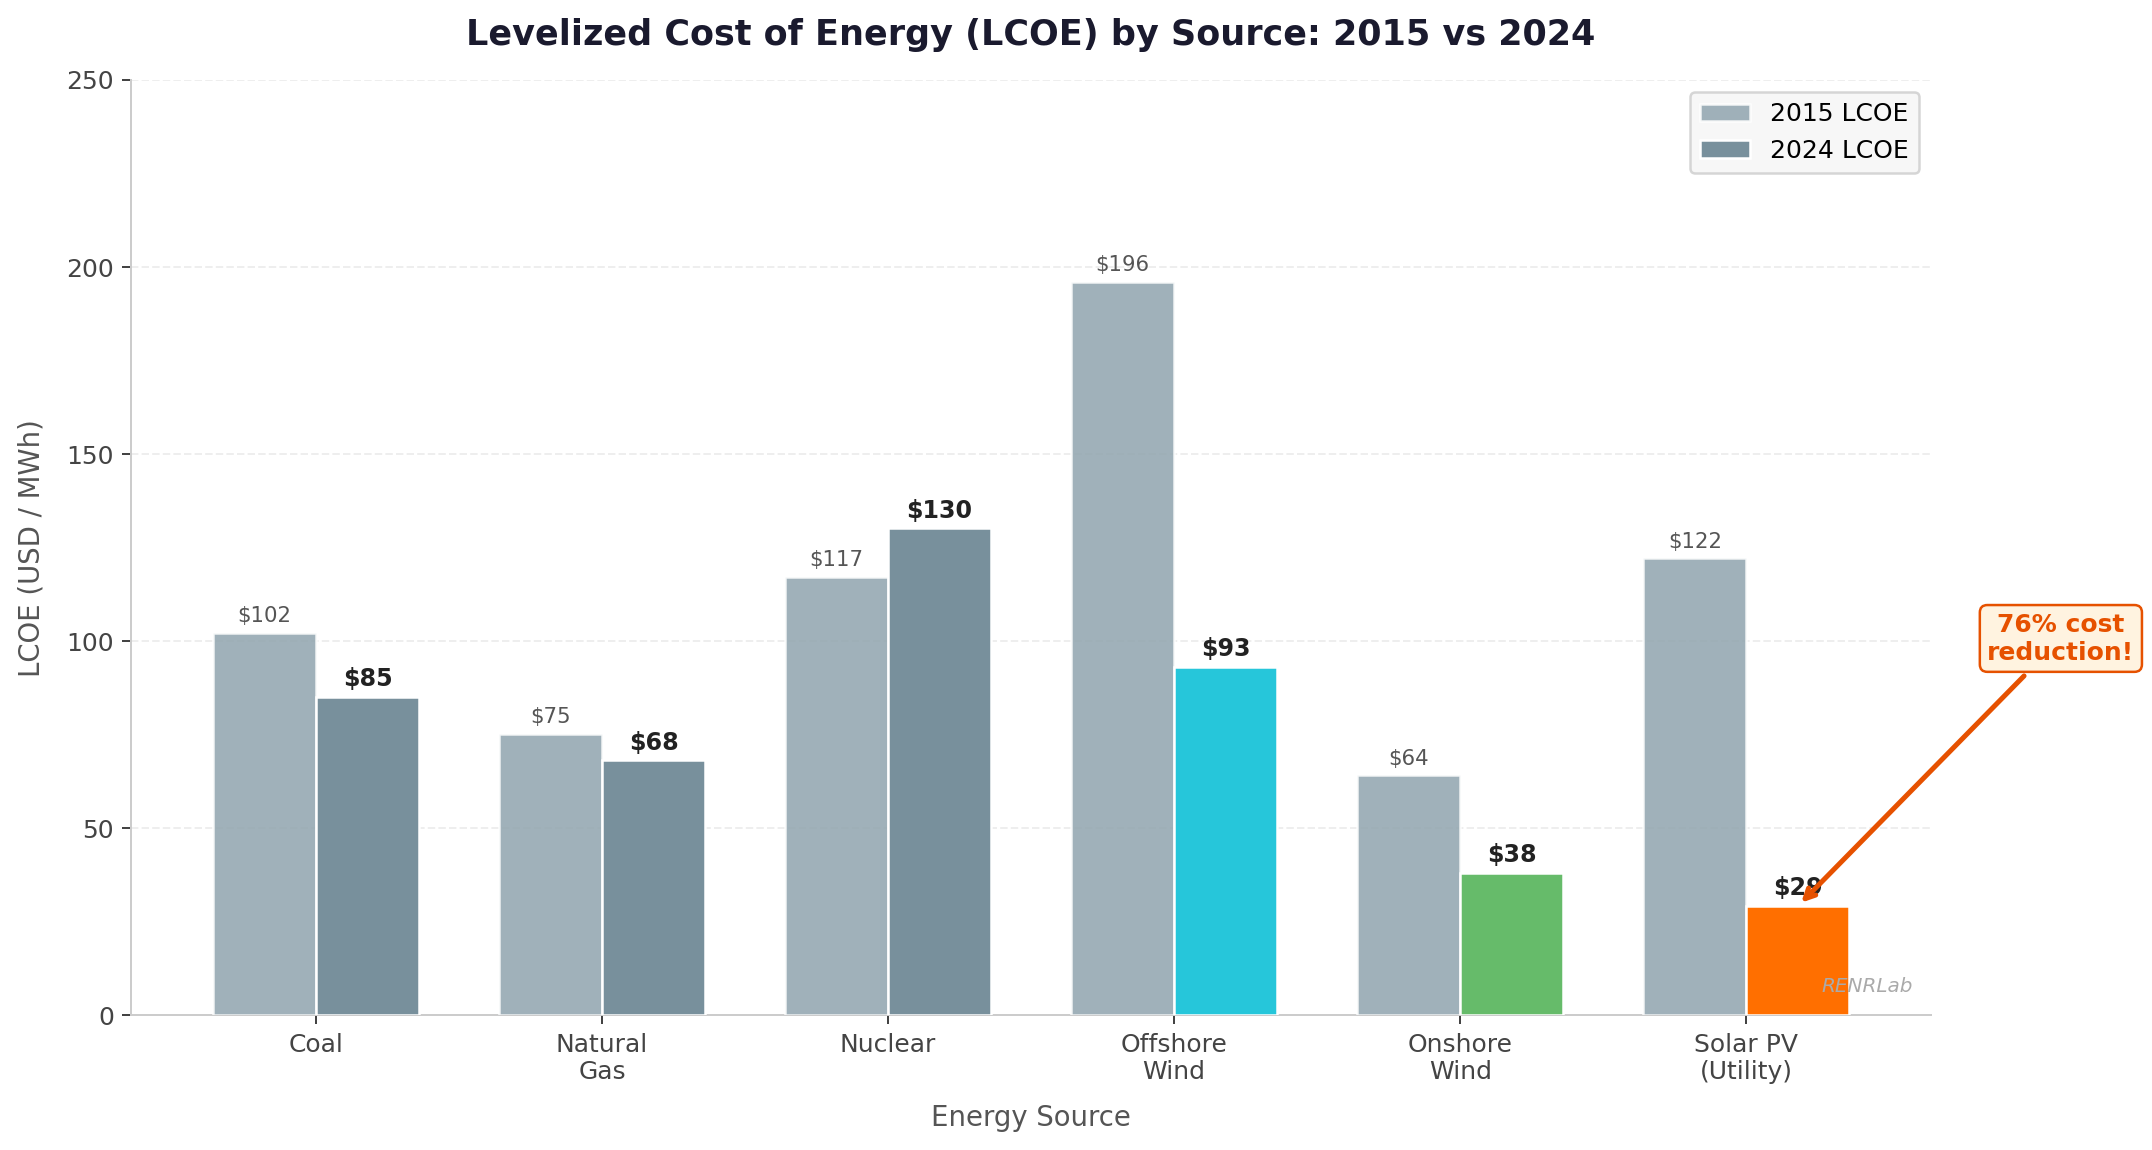
As illustrated in Figure 2, solar PV stands out as the only major energy technology to have reduced its LCOE by more than 70% since 2015. The contrast with nuclear power — whose costs have risen — is particularly stark. This economic reality has moved far beyond academic debate: countries are actively cancelling coal power contracts and replacing planned gas power stations with solar farms, driven purely by the numbers on a spreadsheet.
The Global Energy Mix is Fundamentally Shifting
Just a decade ago, coal dominated global electricity generation, supplying approximately 40% of world power. While coal remains significant in absolute terms, its share is in structural decline. Meanwhile, solar and wind power have grown from a combined 3% in 2010 to approximately 17% of global electricity generation in 2024 — and most credible forecasts project they will surpass 50% of global power generation by the late 2030s.
Advanced economies like Germany, Spain, Portugal, and the United Kingdom have already reached 35–50% renewable electricity generation. Emerging economies are charting their own ambitious paths, often leapfrogging legacy fossil-fuel infrastructure entirely — much as mobile phones displaced fixed landlines across the developing world. The parallel is apt: why build expensive, imported coal infrastructure when locally manufactured solar panels offer cheaper electricity today?
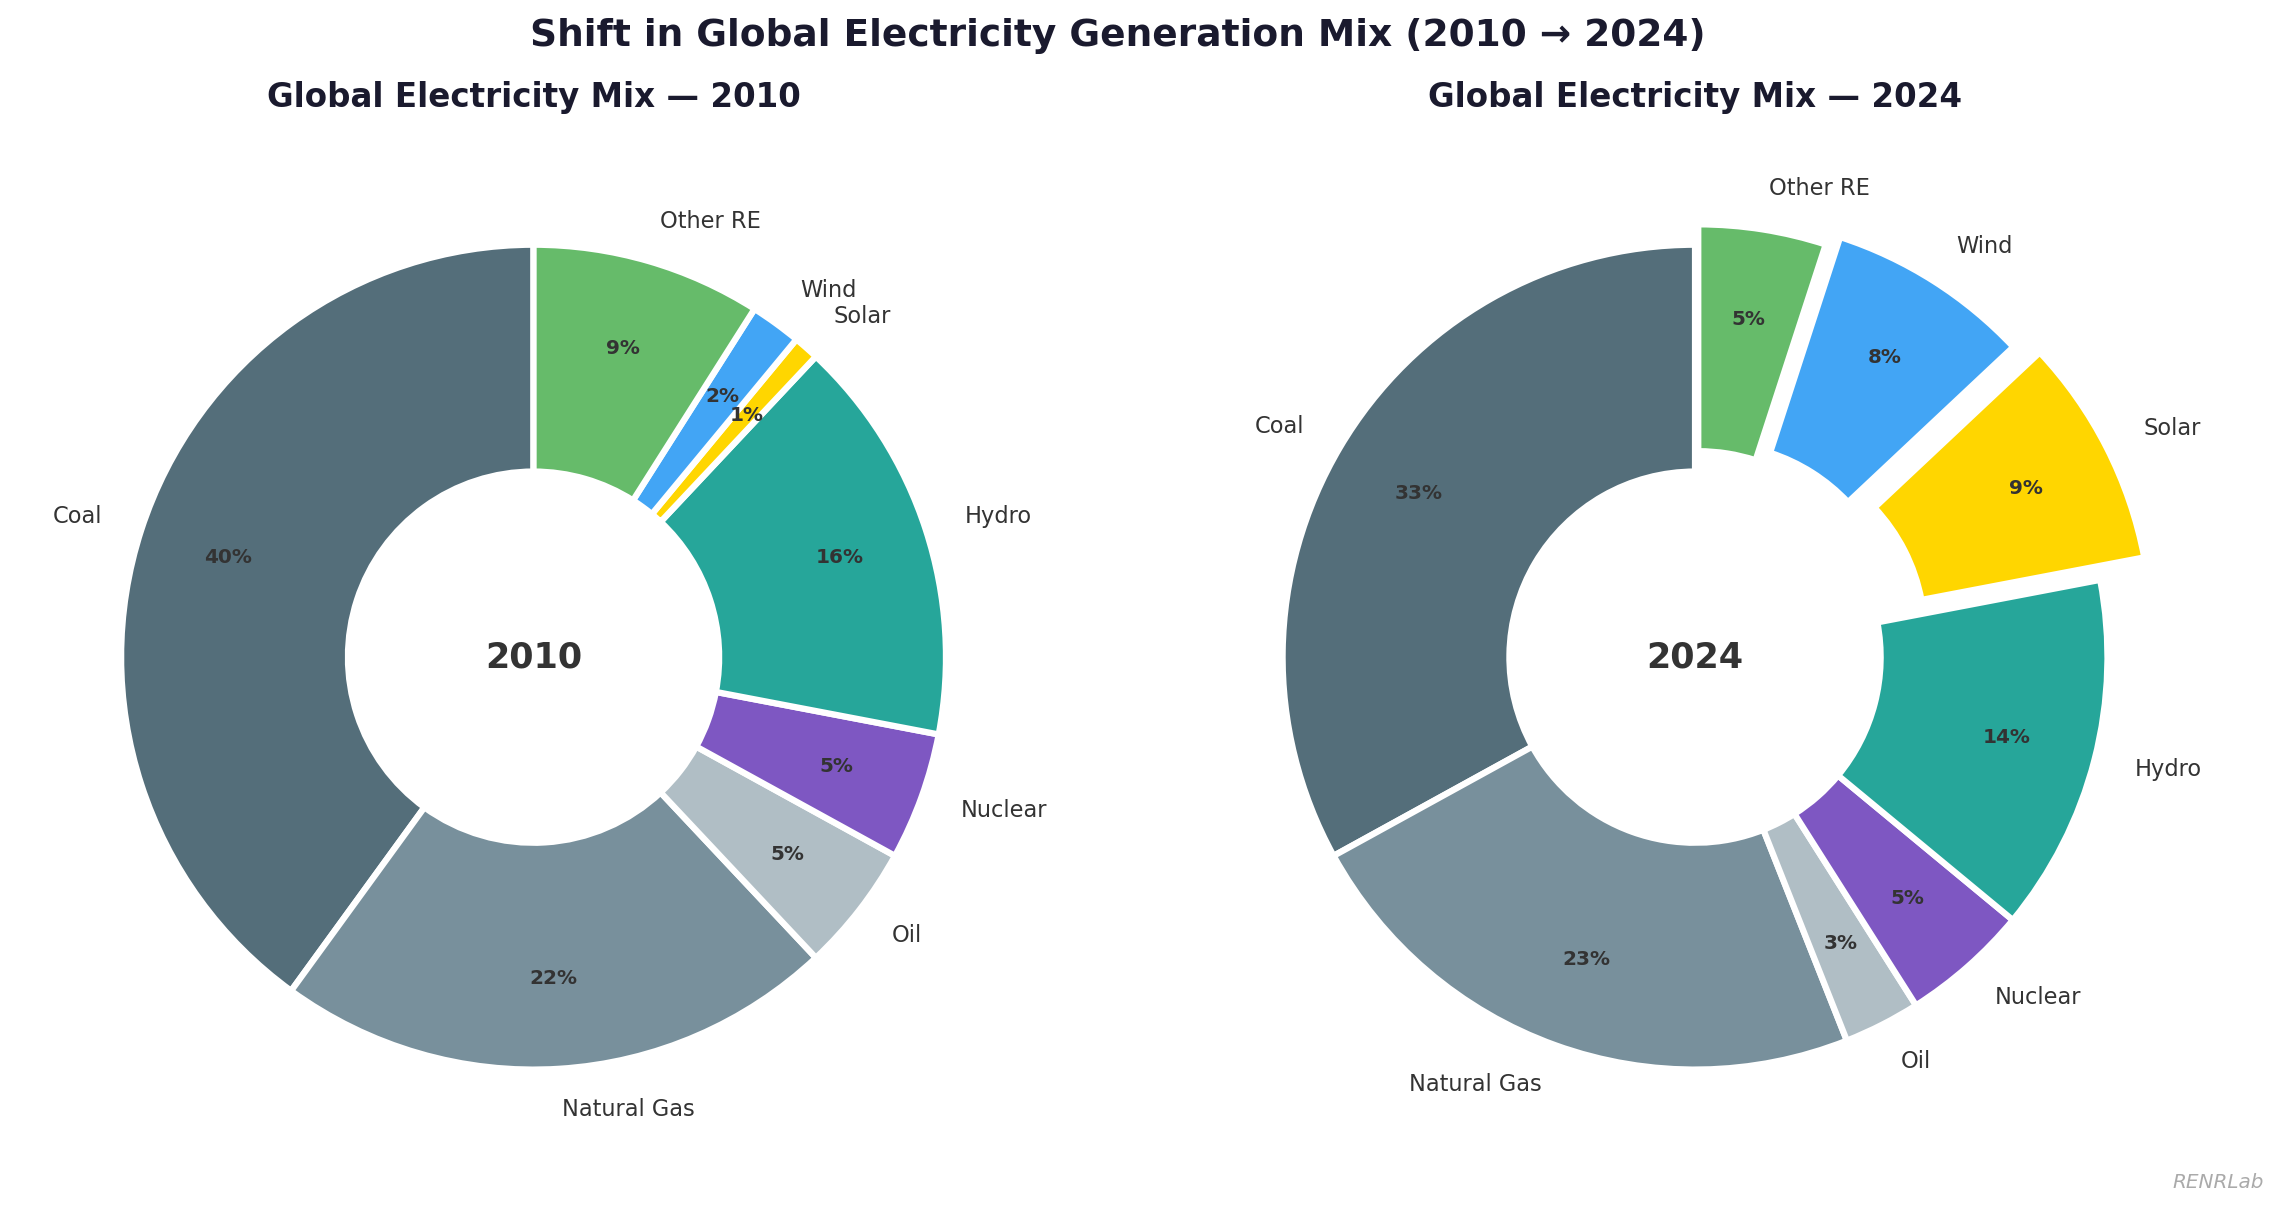
Figure 3 captures this transformation visually. The 2024 chart reflects a genuinely different energy world from 2010 — one where solar and wind have moved from statistical noise to meaningful portions of the global mix. The outer sections representing fossil fuels have visibly shrunk, even as absolute global electricity demand has grown substantially. This means renewable growth is not merely filling new demand — it is actively displacing existing fossil generation.
The concept of the classic energy trilemma — balancing affordability, reliability, and sustainability — historically made it seem impossible to achieve all three simultaneously. Solar energy, when integrated with battery storage, smart grid management, and demand flexibility, increasingly demonstrates that all three goals can be pursued together, not at each other’s expense.
Climate Imperative: The Carbon Equation
The science of climate change is no longer uncertain in any meaningful way. The IPCC’s Sixth Assessment Report (AR6, 2022) states unequivocally that limiting global warming to 1.5°C above pre-industrial levels requires reducing global CO₂ emissions by 45% by 2030 and reaching net-zero by approximately 2050. No technically credible pathway to these targets exists without a massive and rapid expansion of solar energy.
The energy sector is responsible for approximately 73% of all global greenhouse gas emissions. Solar PV, over its entire lifecycle — from manufacturing and installation to operation and eventual recycling — emits roughly 20–50 gCO₂eq/kWh. Compare this to coal at 820 gCO₂eq/kWh and natural gas at 490 gCO₂eq/kWh. Solar is 15–40 times less carbon-intensive than the fossil fuels it displaces. This is not a marginal difference — it is transformational.
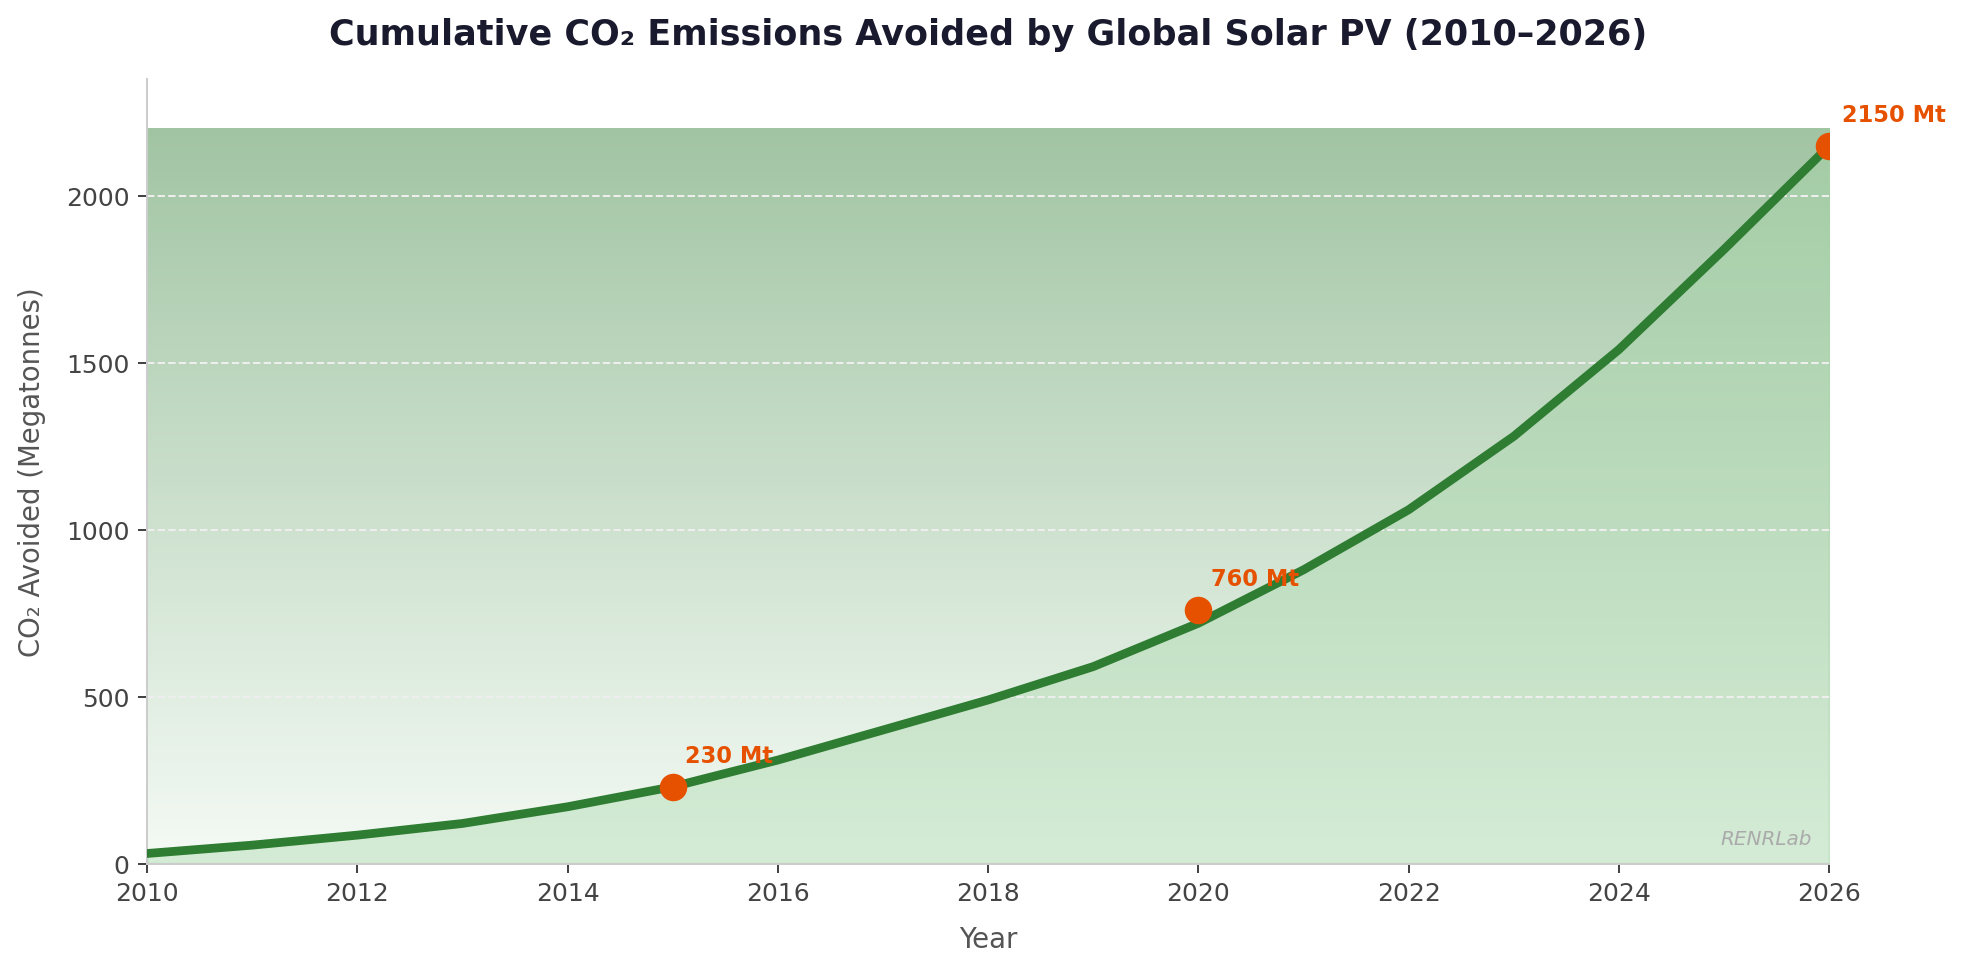
Figure 4 reveals the compounding environmental benefit of solar deployment. By 2026, the global solar fleet is estimated to have avoided over 2,150 megatonnes of CO₂ emissions — equivalent to shutting down more than 500 coal-fired power plants for a full year. This number will grow exponentially as installed capacity scales toward the IEA’s Net Zero target of 14,000+ GW by 2050.
Beyond CO₂, the shift to solar eliminates emissions of nitrogen oxides (NOx), sulphur dioxide (SO₂), and fine particulate matter (PM2.5) that cause severe respiratory and cardiovascular diseases. The World Health Organization estimates that air pollution from fossil fuel combustion causes approximately 7 million premature deaths annually. Solar’s health dividend is enormous — but rarely counted in energy cost comparisons.
Solar and the Paris Agreement
Nations that submitted Nationally Determined Contributions (NDCs) under the Paris Agreement are increasingly counting on solar to meet their commitments. India aims for 500 GW of renewable capacity by 2030, with solar as the primary vehicle. The UAE and Saudi Arabia — major oil producers — have committed to 44% and 50% renewable electricity targets respectively, largely through solar. Even China, the world’s largest emitter, has installed more solar capacity than the rest of the world combined and continues to expand at unprecedented pace.
Jobs, Investment, and Economic Opportunity
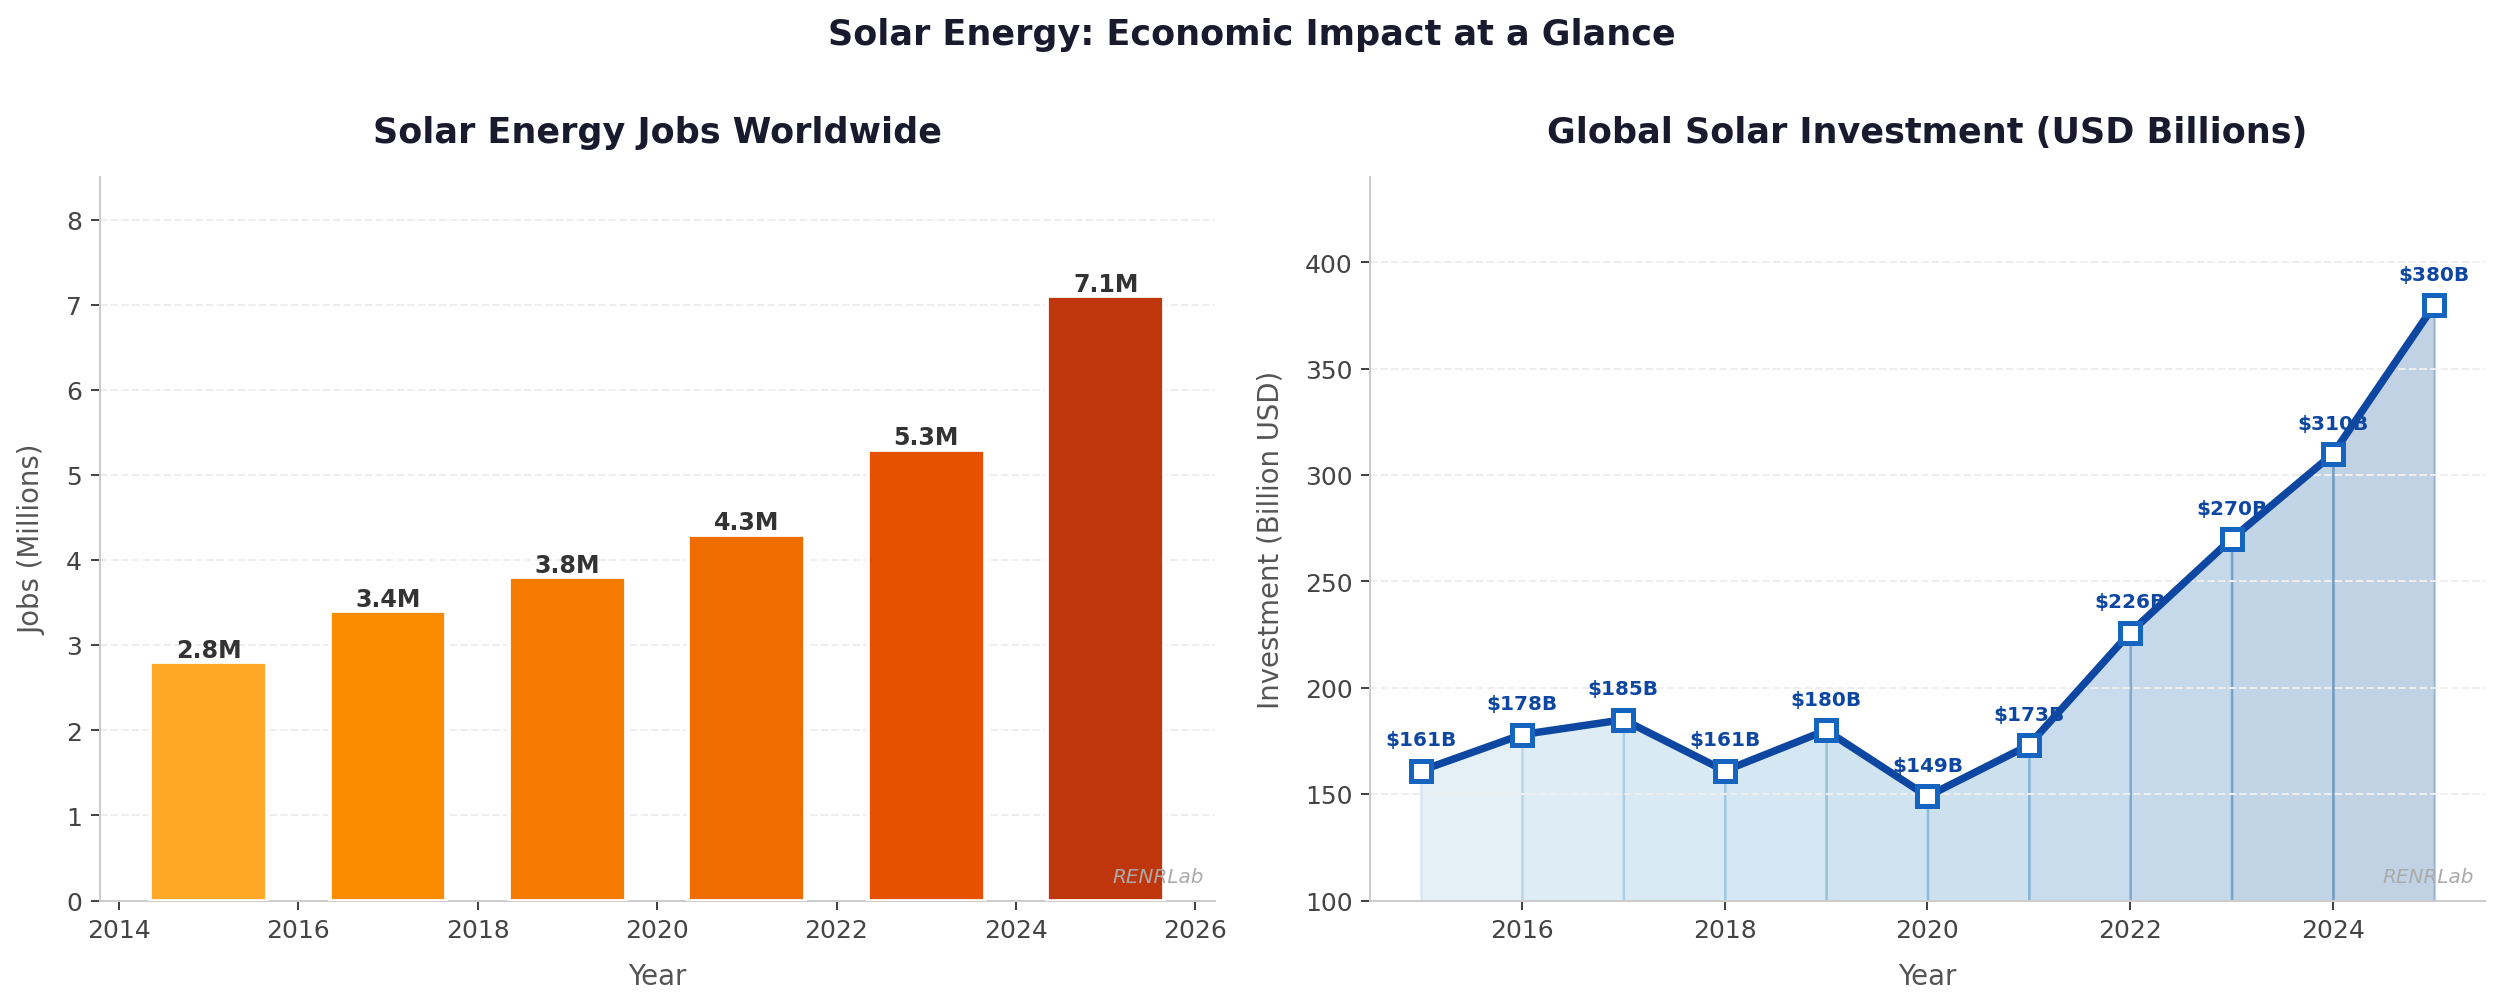
A persistent concern about clean energy transitions has been their impact on employment in fossil fuel industries. The data from the solar sector tells a clear and encouraging story. According to IRENA’s annual Renewable Energy and Jobs report, the solar sector directly employed 7.1 million people worldwide in 2025 — up from 2.8 million in 2015 — representing one of the world’s fastest-growing sources of formal employment.
These are not just jobs in panel manufacturing. They span engineering design, project development, installation, operations and maintenance, grid integration, storage technologies, financing, and policy — a broad ecosystem that creates work across skill levels and geographies. Crucially, unlike fossil fuel jobs concentrated in specific extraction regions, solar jobs are distributed wherever sunlight reaches and rooftops exist.
Global investment in solar energy reached approximately $380 billion in 2025, representing roughly 40% of all clean energy investment globally. This capital is increasingly flowing to developing economies — financing solar farms in sub-Saharan Africa, South Asia, and Southeast Asia that bring electricity access to populations previously dependent on expensive and polluting diesel generators.
Energy Security and Geopolitical Independence
The geopolitical dimension of solar’s rise should not be underestimated. Fossil fuel supply chains have been weaponised repeatedly throughout modern history — from the 1973 OPEC oil embargo to Russia’s manipulation of European gas supplies following the 2022 invasion of Ukraine. Every gigawatt of domestically installed solar capacity represents a permanent reduction in a nation’s exposure to these external shocks. Solar energy is geopolitically inert: sunshine does not cross borders and cannot be embargoed. This strategic benefit alone is sufficient to justify significant solar investment regardless of any cost calculation.
Solar Resource Potential: A Global Perspective
The sun delivers approximately 173,000 terawatts of energy to Earth’s surface at every moment — roughly 10,000 times total human energy consumption. Even accounting for conversion efficiency losses, land use constraints, and atmospheric variability, the technical solar potential of Earth’s surface exceeds any conceivable human energy demand by multiple orders of magnitude. The practical question is never one of resource availability — it is one of technology deployment and policy will.
Global Horizontal Irradiance (GHI) — the total solar energy received per unit horizontal area — varies meaningfully by location. The tropical “solar belt” between the Tropics of Cancer and Capricorn receives the most intense and consistent irradiance, averaging 5–7 kWh/m²/day. This zone encompasses most of South Asia, Southeast Asia, Sub-Saharan Africa, the Middle East, and Latin America — precisely the regions with the fastest-growing electricity demand and the most urgent need for affordable, clean power.
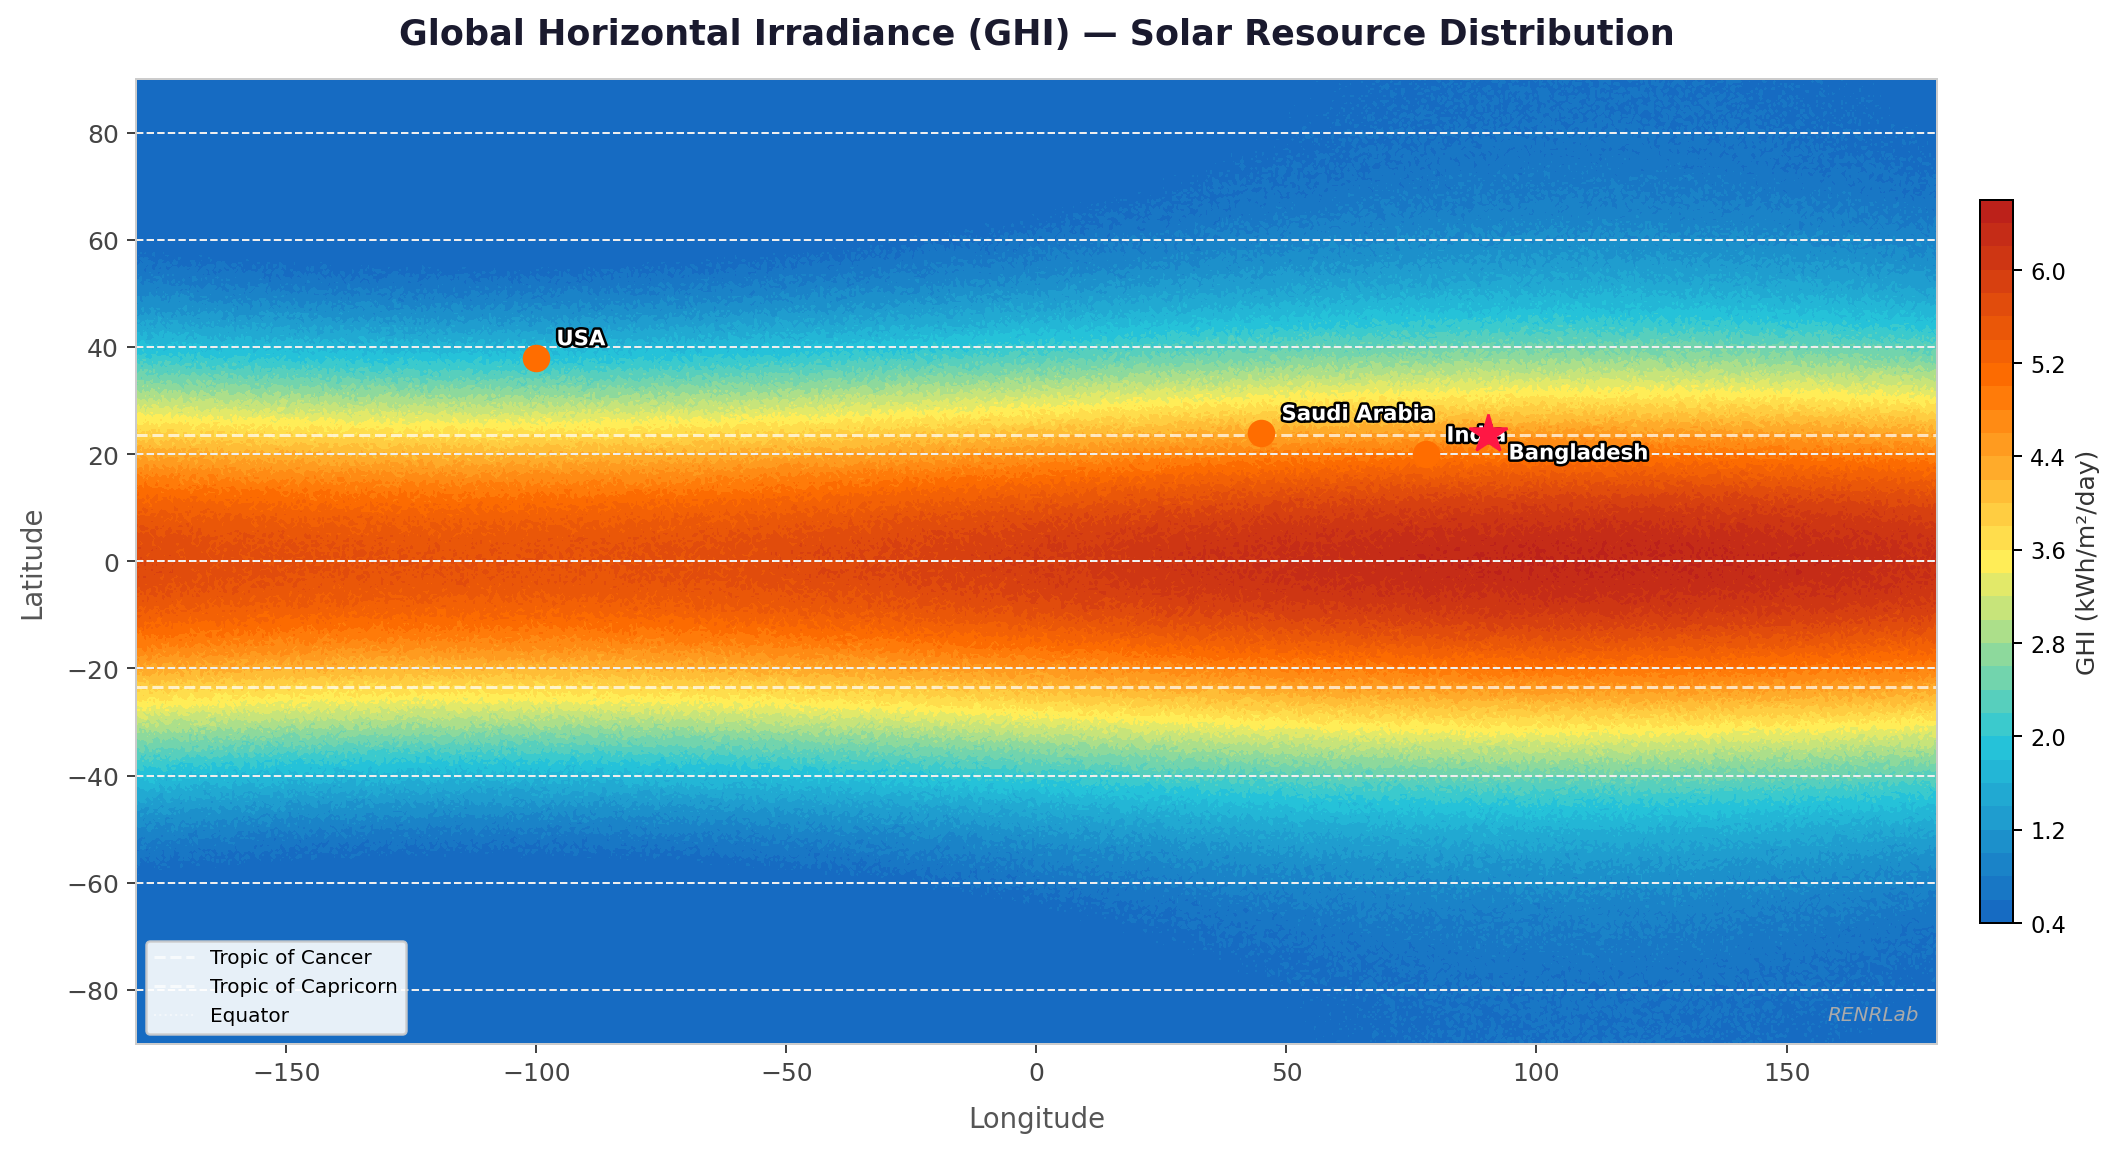
As shown in Figure 6, Bangladesh — highlighted with a star marker — sits squarely within the high-irradiance tropical band. This is not a marginal resource: an average GHI of 4.5–5.5 kWh/m²/day is comparable to Spain and better than Germany, both of which have built substantial and successful solar industries. Bangladesh’s solar resource is a genuine national asset that remains largely untapped.
Emerging technologies are rapidly expanding the geographic and application scope of viable solar deployment. Bifacial solar panels capture both direct and reflected irradiance, increasing yields by 5–15% with no additional land use. Agrivoltaic systems co-locate solar panels above agricultural land, simultaneously generating electricity and improving crop yields through partial shading in hot climates. Building-integrated PV (BIPV) turns glass facades, rooftiles, and even windows into power-generating surfaces. These innovations collectively ensure that solar energy’s addressable deployment base will only expand in coming years.
Challenges and the Path to Solutions
Any honest assessment of solar energy must acknowledge the genuine challenges that accompany its deployment at scale. Intellectual rigour demands we examine these challenges seriously — and equally, the sophisticated solutions being developed and deployed to address them. The following analysis, structured as challenge-solution pairs, reflects the current state of both obstacles and innovation.
⚠ Challenge: Intermittency & Variability
Solar generates electricity only when the sun shines. Clouds, nighttime, and seasonal variation create gaps in supply that must be actively managed at the grid level.
✓ Solution: Battery Storage + Grid Flexibility
Lithium-ion battery costs have fallen 97% since 1991 and continue declining. Grid-scale battery systems, pumped-hydro storage, and demand-response management increasingly buffer solar intermittency at commercially viable costs.
⚠ Challenge: Land Use Competition
Utility-scale solar requires significant land area, raising genuine concerns about habitat loss, land rights conflicts, and competition with agricultural food production.
✓ Solution: Agrivoltaics & Rooftop Solar
Agrivoltaic systems co-locate food crops and solar panels, demonstrating improved agricultural yields in hot climates. Rooftop and carport solar deploy on existing built surfaces, requiring zero additional land.
⚠ Challenge: Grid Integration Stability
High penetrations of variable solar can cause voltage and frequency instability in power grids designed for dispatchable baseload generation, requiring significant grid upgrades.
✓ Solution: Smart Grids & P2P Energy Trading
Advanced smart inverters, AI-based grid management, and peer-to-peer (P2P) energy trading platforms — an active area of RENRLab research — enable stable high solar penetration without expensive grid overhaul.
⚠ Challenge: Panel End-of-Life Waste
Solar panels have 25–30 year operational lifespans. The first generation is now retiring, creating a growing waste stream of silicon, glass, aluminium, silver, and trace heavy metals.
✓ Solution: Circular Economy & Panel Recycling
EU regulations now mandate solar panel recycling infrastructure. New recovery technologies can extract 95%+ of panel materials for reuse in new modules — closing the circular economy loop.
At RENRLab, we engage directly with the grid integration challenge through our research on peer-to-peer (P2P) energy trading with multi-objective optimization. Using NSGA-II-based evolutionary algorithms, we are developing frameworks in which distributed solar prosumers — building and campus owners who both generate and consume electricity — can trade excess solar generation within local microgrids. This approach simultaneously improves system efficiency, reduces grid stress, and creates economic returns for solar investors, demonstrating that the integration challenge is a design and optimization problem with tractable solutions.
The Road Ahead: Solar Scenarios to 2050
The IEA’s Net Zero Emissions by 2050 (NZE) scenario — the most credible roadmap for limiting warming to 1.5°C — requires global solar capacity to reach approximately 14,000–18,000 GW by 2050. This represents a roughly 8–10× expansion from today’s already substantial 1,900 GW installed base. Under this pathway, solar becomes the single largest source of electricity globally, supplying over 33% of total generation by mid-century.
Even the more conservative IRENA “Planned Energy Scenario” — effectively a business-as-usual trajectory — projects over 5,000 GW of solar by 2050. The divergence between these scenarios has profound implications: the lower-ambition pathway corresponds to approximately 2.5°C of global warming, while the accelerated solar pathway is a central component of the 1.5°C pathway. The choice is not purely technological — it is a policy and political economy question of the highest stakes.
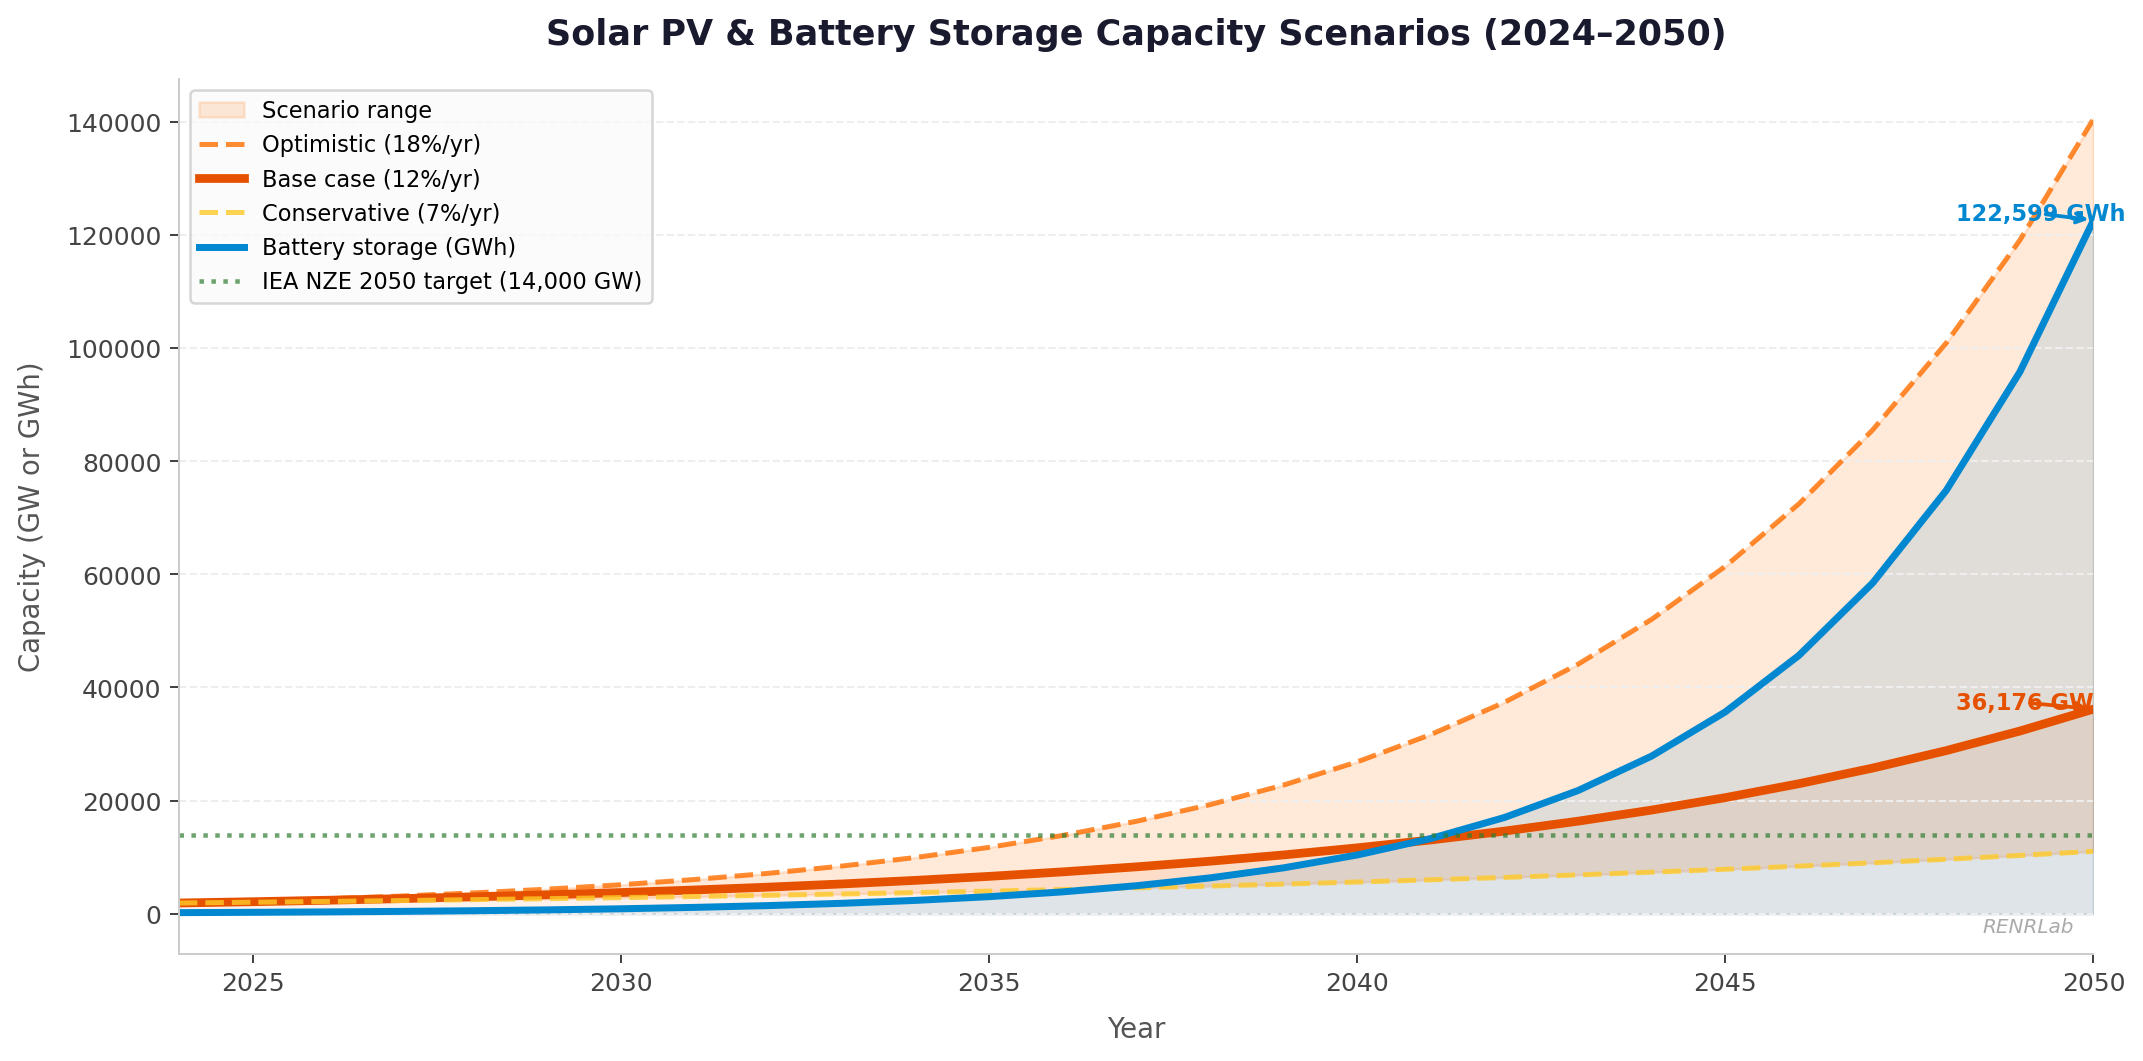
Figure 7 illustrates the critical importance of the next decade’s policy decisions. All three solar scenarios begin from the same starting point in 2024, but diverge dramatically as the years compound. By 2040, the gap between optimistic and conservative scenarios exceeds 10,000 GW — the difference between a world on track for 1.5°C and one heading for catastrophic warming. The window for choosing the optimistic trajectory remains open today, but it is narrowing.
Key enabling technologies for the accelerated pathway include:
- Green hydrogen — using surplus solar electricity to produce hydrogen via electrolysis, enabling seasonal energy storage and decarbonisation of hard-to-electrify industrial processes.
- Vehicle-to-grid (V2G) technology — treating the growing global fleet of electric vehicles as distributed battery storage, absorbing excess midday solar generation for evening discharge.
- Long-duration energy storage — technologies including iron-air batteries, compressed air storage, and gravity-based systems that can store solar energy across days and weeks, not just hours.
- High-voltage direct current (HVDC) transmission — enabling solar electricity generated in the Sahara, Australian outback, or Atacama Desert to reach population centres thousands of kilometres away with minimal transmission losses.
Bangladesh and the RENRLab Connection
Bangladesh occupies a position of both unusual vulnerability and remarkable opportunity in the global solar story. The country is among the most climate-vulnerable nations on Earth — low-lying, densely populated, and highly exposed to sea-level rise, increasingly intense cyclones, and altered monsoon patterns driven by global warming. Yet Bangladesh also sits squarely within the tropical solar belt, endowed with abundant, year-round solar resources.
🇧🇩 Bangladesh Solar Opportunity at a Glance
With an average GHI of 4.5–5.5 kWh/m²/day and approximately 300 sunny days per year, Bangladesh has a solar resource comparable to Southern Spain — one of Europe’s most productive solar regions. Yet as of 2024, solar represents only approximately 3–4% of Bangladesh’s electricity generation, against a national renewable electricity target of 40% by 2041 under the Mujib Climate Prosperity Plan. The gap between resource endowment and current deployment represents both an urgent challenge and a colossal economic opportunity.
Each additional gigawatt of domestically installed solar capacity directly reduces Bangladesh’s import bill for liquefied natural gas (LNG) and coal, improves the trade balance, creates domestic employment, and reduces the carbon intensity of an electricity grid still heavily dependent on gas and oil. For a rapidly growing economy with urgent development needs, solar is not a luxury — it is a strategic economic and environmental imperative.
RENRLab’s Research Contribution
At RENRLab, based at Gopalganj Science and Technology University (GSTU), our research directly addresses the practical engineering and economic challenges of solar deployment in the Bangladesh context. Our current flagship work includes:
- Grid-Connected HRES for GSTU Campus: Design and techno-economic optimisation of a hybrid renewable energy system combining solar PV, wind, diesel backup, and battery storage for the GSTU campus, using HOMER Pro software with Monte Carlo financial feasibility analysis. This research aims to establish GSTU as an energy-independent campus and provide a replicable model for institutional solar deployment across Bangladesh.
- Peer-to-Peer (P2P) Energy Trading: Development and validation of multi-objective optimisation frameworks (including NSGA-II implementation) for peer-to-peer energy trading among distributed solar prosumers in microgrids. This work, building on the methodology of Zeyad et al. (2026), aims to maximise both economic efficiency and social equity in local energy markets.
- Solar-EV Integration: Research into the optimal co-deployment of solar PV capacity with EV charging infrastructure, addressing both energy management and grid interaction challenges in the Bangladesh urban mobility context.
These research streams are united by a common mission: to translate the global solar revolution into practical, scalable, and economically viable solutions specifically suited to Bangladesh’s geography, grid infrastructure, regulatory environment, and development priorities.
Conclusion
The question is no longer whether solar energy will dominate global power systems. That question has been answered — by markets, by engineering, by physics, and by the mathematics of compounding cost reduction. The question now is how quickly the transition can be completed, and how equitably its enormous benefits can be distributed across nations and communities of all income levels.
Seven converging forces make solar’s dominance not merely likely but inevitable: the relentless cost decline driven by manufacturing scale and technological learning; the growing urgency of the climate crisis and its policy consequences; the energy security benefits of domestic generation independence; the employment and economic development opportunity solar creates; the near-universal availability of the solar resource; the supporting ecosystem of batteries, smart grids, and demand management; and the growing momentum of peer-to-peer and distributed energy models that democratise electricity generation.
Challenges remain, and must be taken seriously: grid integration, storage at seasonal timescales, supply chain sustainability, equitable financing access for the developing world, and circular economy infrastructure for panel recycling. These are real engineering and policy problems — but they are tractable ones, being actively solved by researchers, engineers, and policymakers around the world, including at RENRLab.
For Bangladesh, the urgency is particularly acute. A country facing existential climate risk from a system its own emissions have barely affected is simultaneously the beneficiary of one of the world’s great solar resources. Accelerating solar deployment here is not merely an energy policy choice — it is a moral and economic necessity, and one that RENRLab is committed to supporting through rigorous research and practical innovation.
References
- IEA (2024). World Energy Outlook 2024. International Energy Agency, Paris. Available at: iea.org/weo
- IRENA (2024). Renewable Power Generation Costs in 2023. International Renewable Energy Agency, Abu Dhabi. ISBN 978-92-9260-610-9.
- IPCC (2022). Climate Change 2022: Mitigation of Climate Change — Summary for Policymakers. Sixth Assessment Report, Working Group III. Cambridge University Press.
- Lazard (2024). Lazard’s Levelized Cost of Energy Analysis, Version 17.0. Lazard Ltd., New York.
- IRENA (2024). Renewable Energy and Jobs — Annual Review 2024. International Renewable Energy Agency, Abu Dhabi.
- BloombergNEF (2025). New Energy Outlook 2025: Energy Transition Scenarios to 2050. Bloomberg Finance L.P., New York.
- IEA (2023). Net Zero by 2050: A Roadmap for the Global Energy Sector (Updated 2023). International Energy Agency, Paris.
- IRENA (2024). World Energy Transitions Outlook 2024: 1.5°C Pathway. International Renewable Energy Agency, Abu Dhabi.
- Zeyad, A. et al. (2026). Peer-to-peer energy trading with multi-objective optimization in residential microgrids. Energies, 19, 1231. doi:10.3390/en19051231.
- World Bank (2023). Solar Resource Data — Global Solar Atlas 2.0. World Bank Group / Solargis. Available at: globalsolaratlas.info.
- NASA (2024). POWER (Prediction of Worldwide Energy Resources) Database — Surface Solar Irradiance. NASA Langley Research Center, Hampton, VA. Available at: power.larc.nasa.gov.
- RENRLab (2026). Grid-Connected Hybrid Renewable Energy System Design and Optimisation for GSTU Campus, Bangladesh. Internal Research Report, Gopalganj Science and Technology University.
Note on Figures: Figures 1–7 were generated by RENRLab using Python (Matplotlib, NumPy, Pillow) based on data from the cited sources. All figures are original RENRLab productions and may be reproduced with attribution.


